
 CS
CS  EN
EN  DE
DE  NL
NL  IT
IT  FR
FR  ES
ES  PT
PT  DA
DA  SV
SV  FI
FI  EL
EL  HU
HU  ET
ET  BG
BG  PL
PL  JA
JA  KO
KO If you do not understand your e-bike dashboard, you can make the wrong decisions even when the bike itself is working properly. Riders often look at a fast-changing battery bar or a high assist mode and assume the bike has a fault, the battery is weak, or the motor is underperforming.
That confusion gets more expensive on a cargo bike. A family rider may start a school run with too much assist and finish with less range than expected. A delivery operator may push heavy loads at the wrong cadence and drain batteries faster across an entire fleet. A brand buyer may choose the wrong display logic for target users and create avoidable support issues.
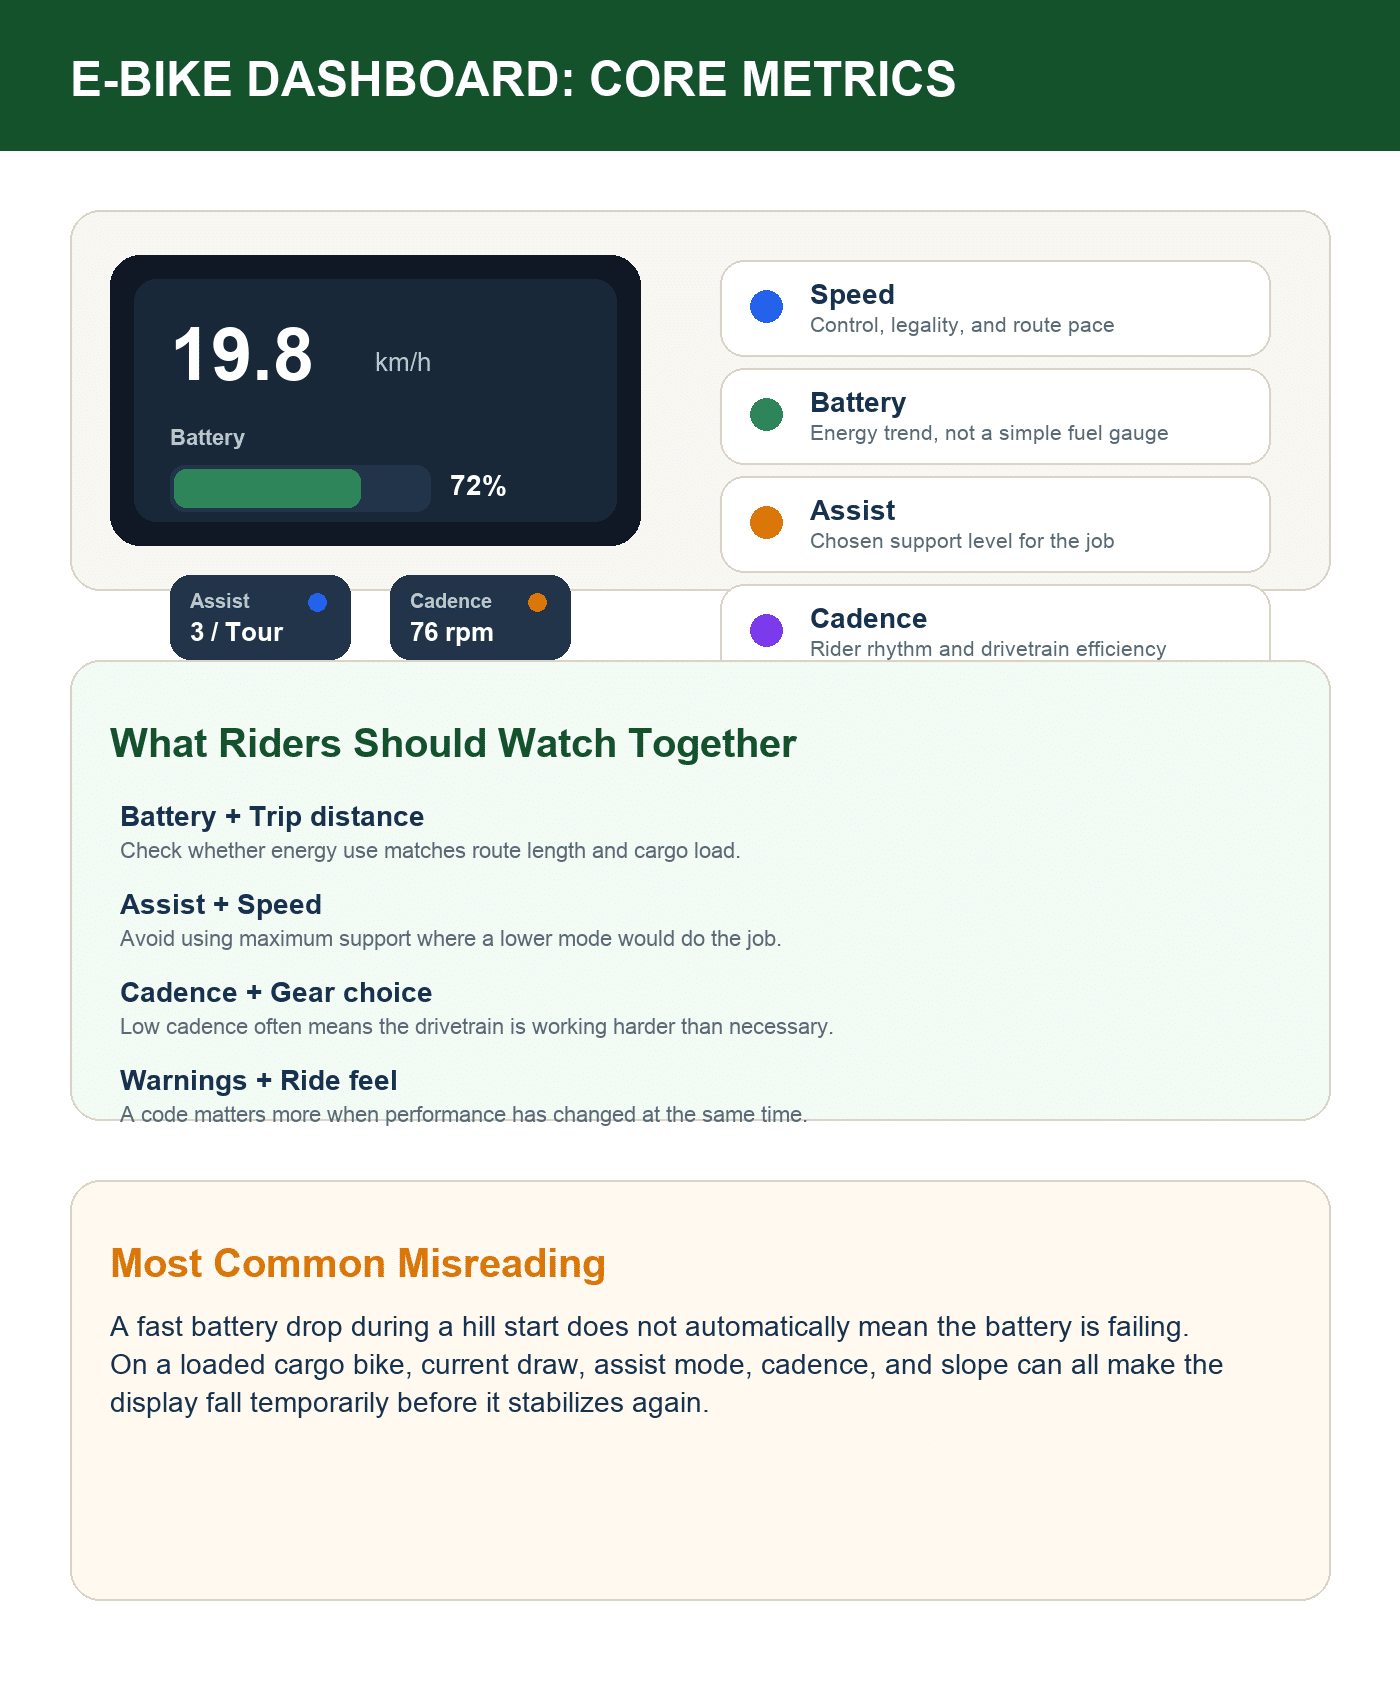
The short answer is this: the most important dashboard numbers are not just speed and battery percentage. On a cargo e-bike, you should read speed, assist level, cadence, battery state, trip distance, and warning indicators together. That combination tells you whether the bike is operating efficiently, whether the rider is using the right gear and assist mode, and whether the system is behaving normally for the load and route.
Why Dashboard Numbers Matter More on Cargo E-Bikes
A city commuter e-bike can hide a lot of inefficiency because the total load is low and the ride is short. Cargo bikes cannot. When the bike carries children, parcels, tools, groceries, or commercial equipment, small mistakes in assist mode, gearing, or route planning show up much faster.
That is why the dashboard matters:
- It helps riders choose a realistic cruising speed instead of chasing a misleading top-speed number.
- It shows whether the battery is dropping normally for the route and payload.
- It reveals whether the rider is spinning too slowly or too quickly for efficient motor support.
- It gives operators a quick way to spot rider-behavior issues before they become maintenance or range complaints.
- It helps OEM and ODM buyers decide what level of display complexity their users can actually understand.
For broader background on motor behavior and system setup, Regen’s electric cargo bike motor power system FAQ a mid-drive vs. hub motor guide provide the system context behind the numbers on the screen.
The Core Dashboard Numbers and What They Really Mean
Most e-bike dashboards present similar data even when the interface design differs. The mistake is assuming every number is equally important at every moment.
Rychlost
Speed tells you how fast the bike is moving, but on a cargo e-bike it is mainly a control metric, not a bragging metric.
Use it to answer practical questions:
- Are you riding at a safe speed for the load and road surface?
- Are you cruising in the legal assist range for your market?
- Are you using too much assist for a route that does not need it?
If speed is lower than expected, that does not automatically mean the motor is weak. Payload, wind, tire pressure, assist mode, gearing, and local legal speed limits all influence the number. Regen’s article on how fast an electric cargo bike can go is useful if the rider confuses legal speed, claimed speed, and real-world cruising speed.
Battery Bars or Battery Percentage
Battery display is the number riders watch most, and the number they misunderstand most.
Battery bars or percentages are not a perfect fuel gauge. They are an estimate based on voltage, battery management logic, current draw, and sometimes riding history. On a loaded cargo bike, the display may drop quickly during acceleration or on hills, then recover slightly on flatter sections.
Read battery data correctly:
- A temporary drop under heavy load is normal.
- A stable but steadily fast decline often means the rider is using a higher assist mode than necessary.
- A battery that falls unusually fast in mild conditions may point to route mismatch, underinflated tires, heavy payload, or battery aging.
- A rider should compare battery state with trip distance and payload, not judge battery health from bars alone.
For battery expectations, riders should also understand charging, range, and usage patterns. Regen already covers part of that system thinking in its battery and motor FAQ content.
Assist Level or Power Mode
Assist level shows how much motor support the system is set to provide. On many bikes this appears as Eco, Tour, Sport, Turbo, or as numeric levels such as 1 to 5.
This number does not mean the motor is permanently outputting a fixed amount of power. It usually means the controller is allowing a different level of support relative to rider input.
V praxi:
- Lower assist modes usually improve range and make the bike easier to control on flat sections.
- Higher assist modes help with heavy starts, ramps, headwinds, and repeated stop-start delivery work.
- If riders stay in maximum assist all the time, they often create unnecessary battery drain and less predictable traction on wet or crowded surfaces.
For cargo-bike users, assist mode should change with the job. A school-run bike on a flat return trip should not be ridden the same way as a fully loaded delivery bike climbing a bridge.
Cadence
Cadence is how fast the rider is pedaling, usually measured in revolutions per minute. Not every display shows it, but when it does, it is one of the most useful efficiency metrics on the bike.
Cadence helps answer a deeper question: is the rider and motor working in a comfortable rhythm, or is the system being pushed in the wrong part of its operating range?
On cargo bikes:
- Very low cadence often means the rider is grinding too hard in a tall gear.
- Very high cadence may mean the rider needs a higher gear or is overrunning the efficient assist zone.
- A healthy cadence usually supports smoother starts, better climbing control, and less strain on knees, chain, and motor system.
This becomes especially important on mid-drive bikes, where motor performance is closely tied to gearing and pedaling rhythm. That is why dashboard cadence data is more than “extra information.” It is a decision tool.
Trip Distance and Odometer
Trip distance tells you what happened today. Odometer tells you what has happened over the life of the bike.
For individual riders, trip distance helps compare route length with battery use and identify whether range expectations are realistic.
For fleet operators, odometer data matters for:
- maintenance scheduling
- battery cycle planning
- service interval forecasting
- resale or asset tracking
Distance data becomes far more useful when paired with load profile and route type. A 20 km day with light cargo is not the same as a 20 km day with repeated stops and steep ramps.
Odhadovaný dosah
Estimated range is helpful, but only when riders understand that it is dynamic.
Most systems calculate range from current battery state plus recent riding behavior. If a rider spends the first 10 minutes in a high assist mode with a heavy load, the number can look pessimistic. If the route later flattens out, the estimate may improve.
That means estimated range should be used as a planning signal, not a promise.
The right use is:
- compare it with route distance before departure
- watch how it changes after terrain or assist-mode changes
- use it to trigger an efficiency adjustment before range anxiety becomes a real problem
Error Codes and Warning Icons
Warning icons are often the most ignored data on the display until the bike stops behaving normally.
Common warnings can relate to:
- sensor communication
- motor or controller faults
- brake cut-off activation
- low voltage
- lighting or accessory issues
Riders should not treat every warning as a serious failure, but they also should not keep riding blindly. A recurring warning combined with weak assist, abnormal battery drop, or inconsistent speed data usually means the bike needs diagnosis. Regen’s article on why an e-bike may not be going fast is a useful troubleshooting reference when dashboard readings and real-world performance do not match.
How to Read the Dashboard Correctly in Real Riding
The dashboard becomes useful when riders stop checking one number in isolation.
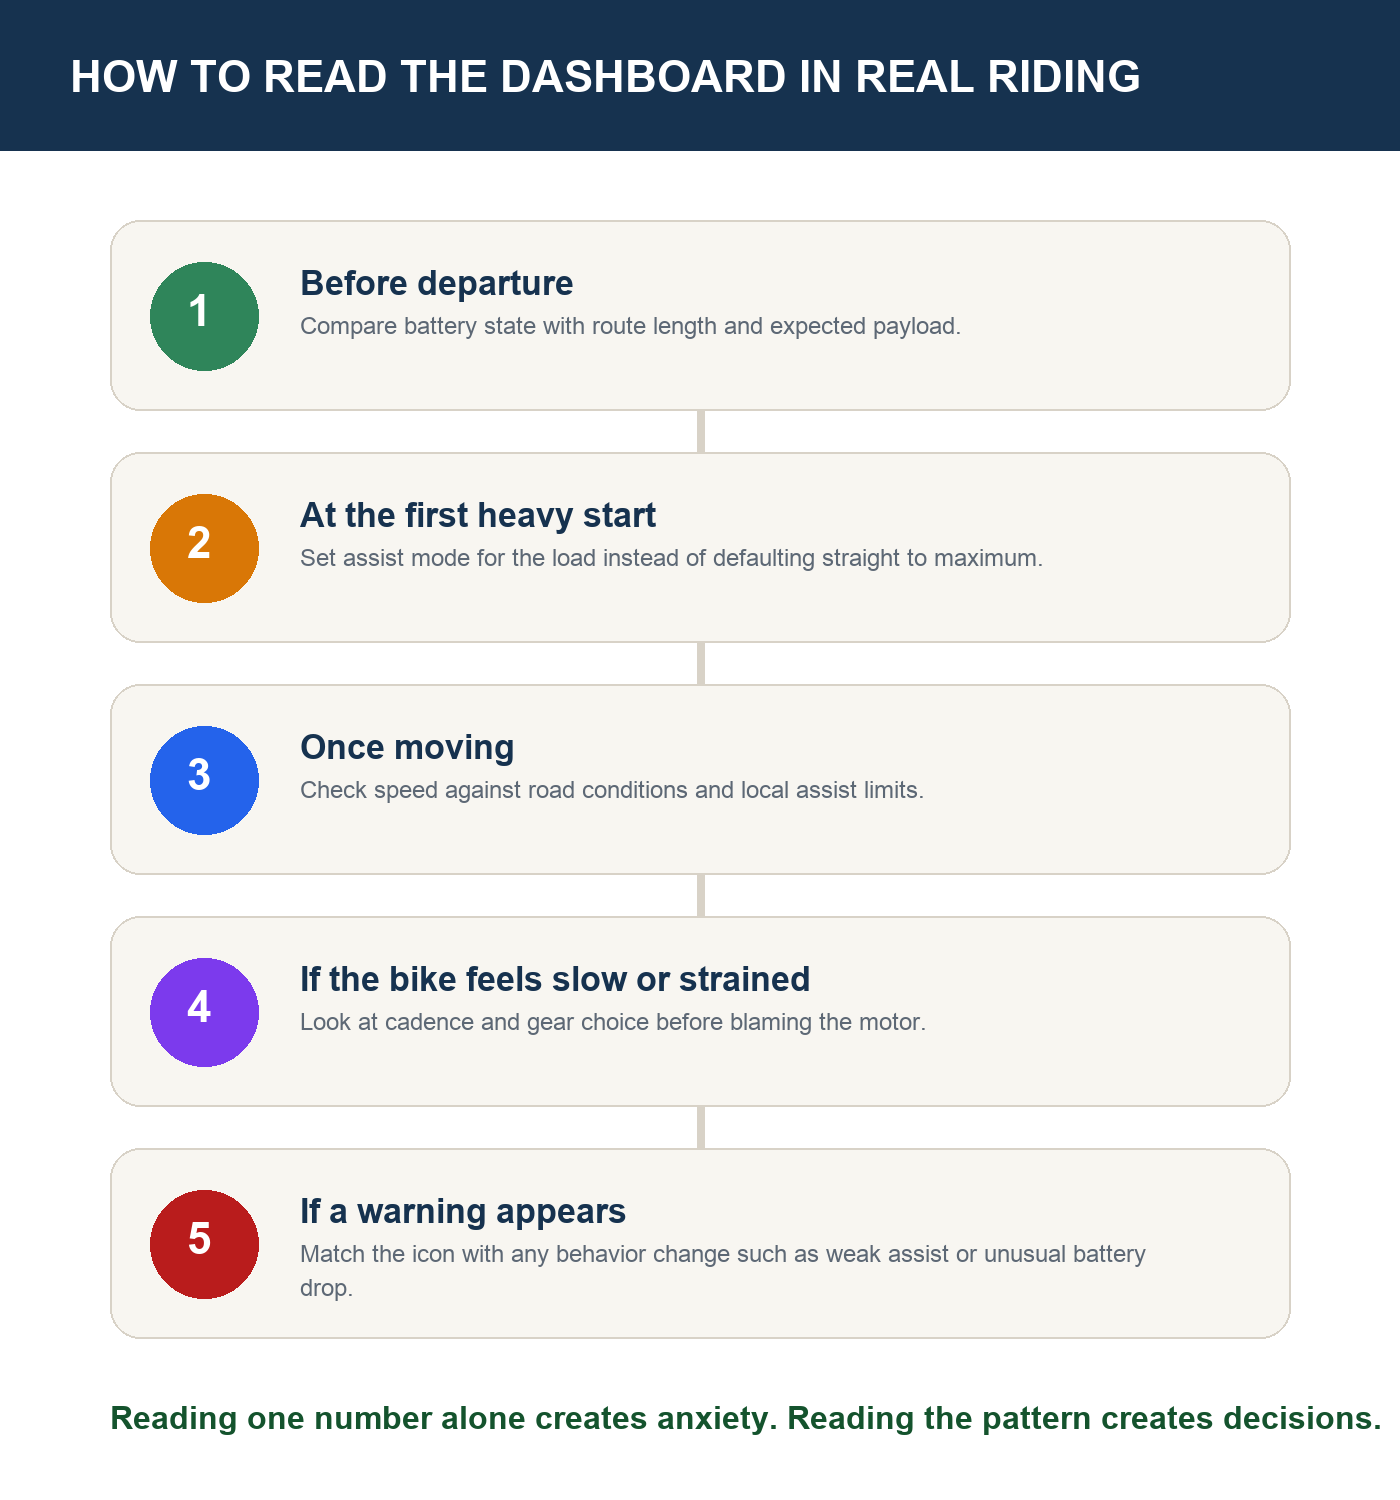
Here is the practical reading method:
- Podívejte se na stránky . battery state + planned distance before the ride starts.
- Podívejte se na stránky . assist level + cargo load when leaving from a stop or climbing.
- Podívejte se na stránky . speed + road environment to avoid using power where control matters more than pace.
- Podívejte se na stránky . cadence + gearing if the bike feels heavy, noisy, or inefficient.
- Podívejte se na stránky . warnings + behavior changes before assuming the issue is just rider fatigue or low charge.
This is the difference between watching a dashboard and using a dashboard.
What the Numbers Mean for Different Types of Users
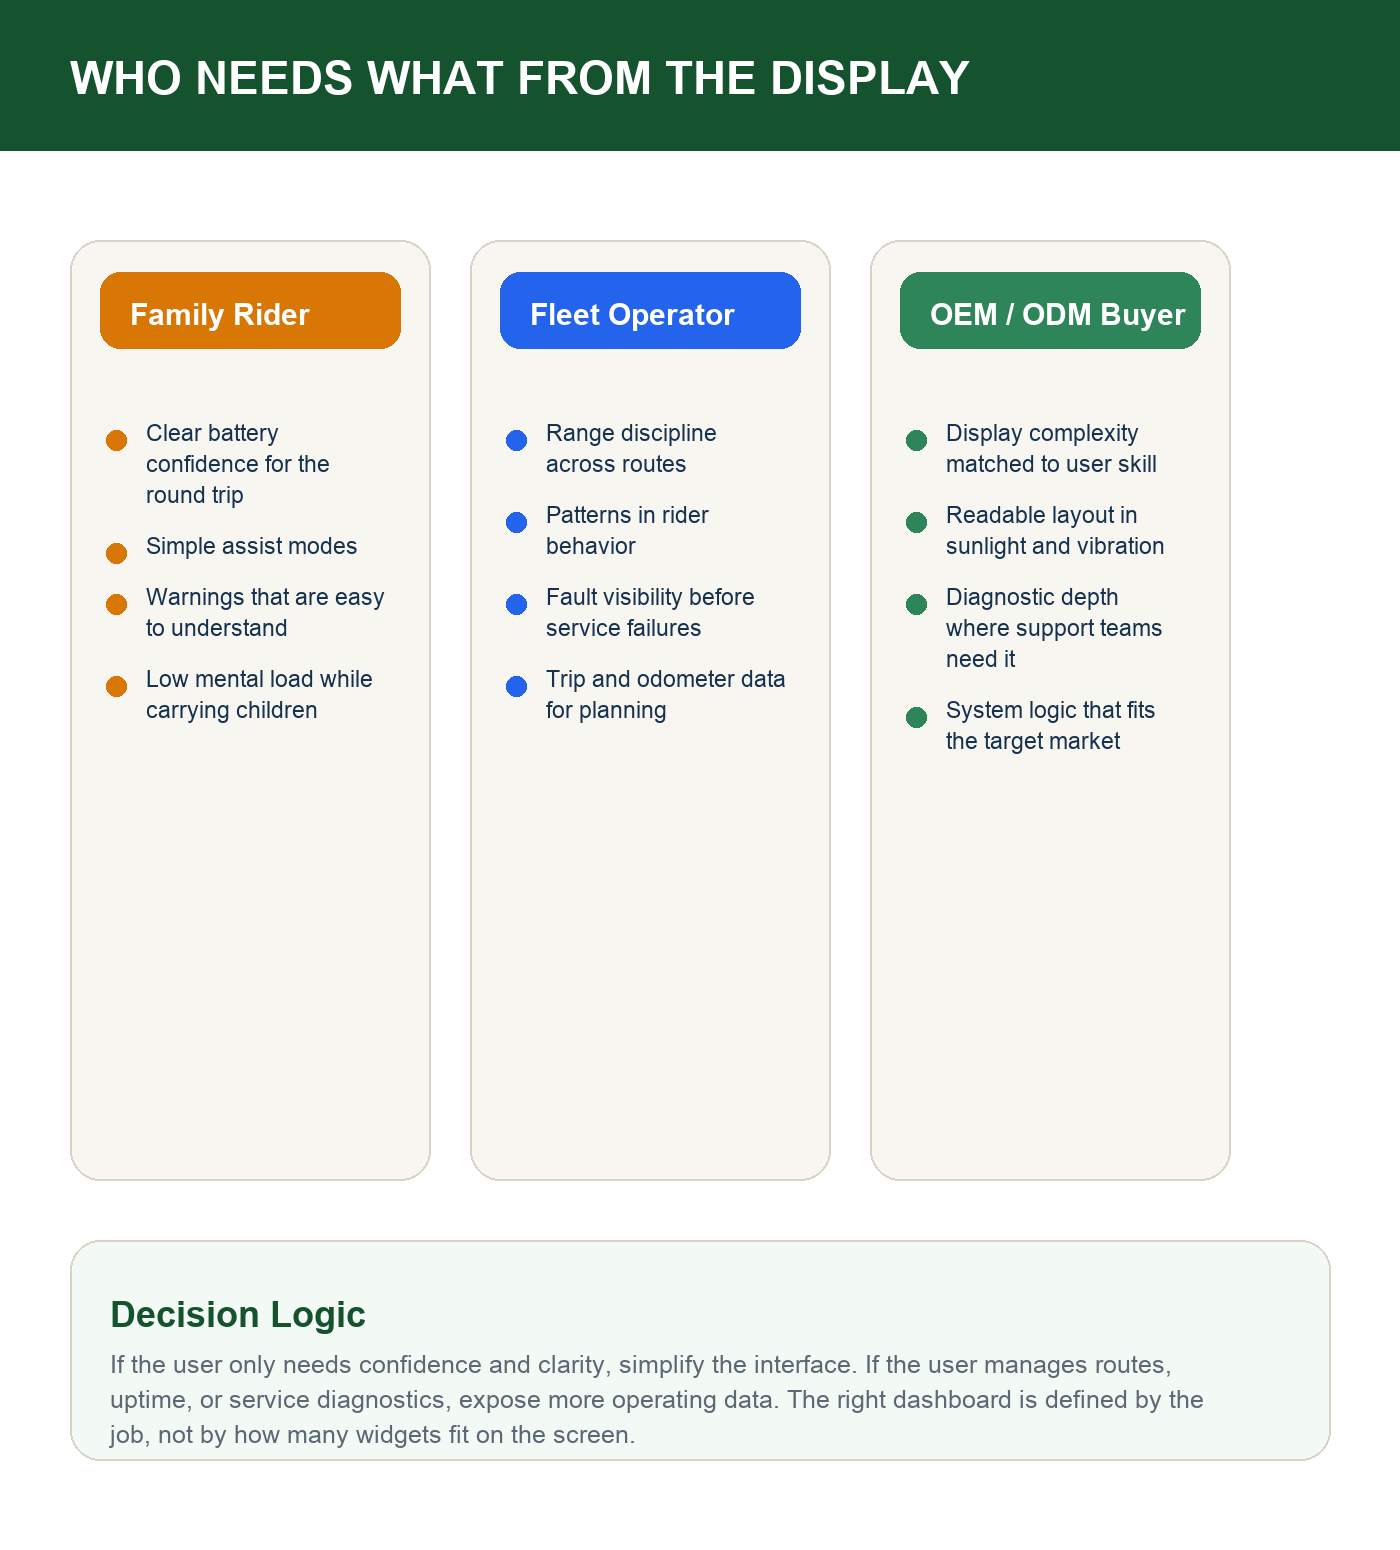
The same screen means different things to different riders. This is where user impact becomes practical.
Family riders
Family riders need confidence, predictability, and easy interpretation. They care less about maximum data density and more about simple signals:
- enough battery for the full round trip
- stable speed in child-carrying situations
- a clear assist mode that feels intuitive
- warnings that are obvious and not overly technical
If the display is too busy or confusing, it adds mental load at the exact moment the rider should focus on children, traffic, and balance.
Delivery riders and fleet operators
Commercial users benefit more from operational visibility:
- range versus route length
- assist mode impact on daily battery usage
- rider efficiency patterns
- recurring fault signals across the fleet
For this user group, dashboard data affects cost. Poor interpretation leads to more charging interruptions, inconsistent route completion, and more avoidable service complaints.
Brand buyers and OEM/ODM product planners
For B2B buyers, the dashboard is not just a rider interface. It is part of the product specification strategy.
A sophisticated TFT display may look attractive, but it is not always the best decision. If the target market is family mobility, rental, municipal service, or entry-level logistics, clarity often matters more than feature density.
The right dashboard choice depends on:
- cílová úroveň dovedností jezdce
- intenzita trasy
- zda kolo používá nábojový nebo středový pohon
- zda produkt potřebuje jednoduché školení nebo hlubší diagnostiku
- zda poprodejní podpora zvládne pokročilejší rozhraní
Toto je logika reálného použití, ne jen preference komponent.
Jak v praxi zavést lepší používání displejů
Pokud prodáváte, specifikujete nebo provozujete nákladní kola, vzdělávání o displejích by mělo být součástí implementačního procesu.
Pro jezdce
- Vysvětlete, jak vypadá normální pokles napětí baterie při zátěži.
- Vysvětlete, že úroveň asistence je nastavení ovládání, ne trvalý slib výkonu.
- Ukažte, jak kadence a převody ovlivňují pohodlí a dojezd.
- Školte jezdce, aby porovnávali vzdálenost jízdy s využitím baterie během několika jízd, ne jedné izolované trasy.
Pro správce vozových parků
- Standardizujte školení jezdců ohledně disciplíny v režimech asistence.
- Vytvářejte plánování tras podle realistické cestovní rychlosti, ne špičkové rychlosti.
- Zaznamenávejte opakující se vzorce chybových kódů podle kola a jezdce.
- Používejte vzorce chování počítadla kilometrů a baterie k plánování údržby dříve, než dojde k poruchám.
Pro OEM a ODM týmy
- Přizpůsobte složitost displeje profilu uživatele.
- Zajistěte, aby varovné stavy byly snadno interpretovatelné.
- Vyhněte se přeplněným rozhraním, která skrývají nejdůležitější data o jízdě.
- Testujte čitelnost displeje s rukavicemi, slunečním světlem, vibracemi a provozem start-stop.
Služba přizpůsobení nákladních kol na úrovni komponent je zde relevantní, protože výběr displeje je součástí širšího rozhodování o návrhu systému, ne kosmetický dodatek.
Časté chybné čtení displejů, které vedou ke špatným rozhodnutím
Toto jsou nejčastější chyby v interpretaci:
“Moje baterie klesla o dva dílky na kopci, takže je baterie špatná.”
Ne nutně. Těžké zatížení, silná asistence, nízká kadence a sklon mohou způsobit dočasný pokles.
“Moje kolo jede jen 23 km/h, takže je něco špatně.”
Možná ne. Zákonné limity asistence, náklad, vítr, odpor povrchu a profil trasy ovlivňují zobrazenou rychlost.
“Vždy používám Turbo, protože se cítím bezpečněji.”
To může vyřešit jeden problém, ale vytvořit další. Nadměrná asistence může snížit dojezd, zvýšit riziko prokluzu kol na kluzkém povrchu a skrýt špatné návyky při řazení.
“Displej ukazuje dojezd 55 km, takže tomu mohu plně důvěřovat.”
Toto číslo je odhad založený na nedávných podmínkách. Mělo by sloužit jako vodítko pro plánování, ne nahrazovat úsudek.
Praktický pohled Regen
Na nákladním e-kole by měl displej pomáhat jezdcům dělat lepší rozhodnutí, ne jen zobrazovat více dat. Nejužitečnější obrazovky jsou ty, které jasně komunikují rychlost, stav baterie, úroveň asistence, vzdálenost jízdy a varování, s kadencí zahrnutou, když to jízdní styl nebo pohon činí hodnotným.
Pokud čtete tato čísla společně, obvykle poznáte, zda je kolo řízeno efektivně, zda trasa a náklad odpovídají nastavení a zda se vyvíjí skutečná závada. Pokud čtete pouze jedno číslo najednou, displej se stává zdrojem zmatku místo vhledu.
Pro rodinné uživatele to znamená méně úzkosti z dojezdu a předvídatelnější každodenní jízdu. Pro provozovatele flotil to znamená lepší disciplínu baterií, méně falešných hlášení o závadách a konzistentnější výkon na trase. Pro kupující OEM a ODM to znamená výběr zobrazovacího systému, který odpovídá skutečnému použití, místo předimenzování rozhraní.
Rychlé shrnutí
Čísla na displeji vašeho e-kola jsou důležitá, protože vysvětlují, jak se celý systém chová při skutečném zatížení. Rychlost ukazuje kontrolu a zákonnost. Stav baterie ukazuje energetický trend, ne jen zbývající náboj. Režim asistence ukazuje nastavení podpory. Kadence ukazuje, zda jsou vstup jezdce a chování motoru sladěny. Odhady dojezdu ukazují riziko plánování. Varovné ikony ukazují, kdy kolo potřebuje pozornost.
Jakmile jezdci pochopí tuto logiku, obrazovka přestane být sbírkou symbolů a stane se praktickým provozním nástrojem.